

Everyone is trying to make sense of these market conditions. Our market signal has guided us over the past few months to stay safe and profitable.
Meanwhile, fintwit continues to exhort their rabid followers to buy the dip because apparently the turn is near. No concrete reasons follow…just blind faith to buy the dip because markets always bounce back and YTD highs are around the corner.
Many of these idiots even went on heavy margin to DCA lower into their pump-and-dump favorite stocks like APP, RDDT, DUOL, PYPL, UBER, AXON etc.
Meanwhile, we asked our readers to look for signs that green shoots might be sprouting. We told them to keep an eye on the post-Q4-ER market reaction for stocks like HOOD, ALAB, SHOP, APP, NBIS, COIN, VRT, OPEN, UPST and perhaps more importantly MCD, KO and WEN.
To no surprise of ours, many of these AI, tech, momentum and meme stocks got sold in spite of decent earnings reports and realistic guidance. Meanwhile low-K-shaped-economy stocks like MCD, WMT and KO got bought. Value stocks like UNH were bid higher.

Welcome to Beachman’s Salty Trades, where we speculate in the market that is in front of us, irrespective of the direction in which it is moving, using stocks, ETFs and options.
NOTE: We are currently offering only the Monthly plan. There is no annual plan, discounts, promos or prorated refunds for early cancellations. Cancelled subscriptions last until end of the paid period. We will be winding down this substack sometime in 2027. Future plans are TBD.
Table of contents
Beachman’s market BUY/SELL/HOLD signal
Recently completed Salty trades
In-progress Salty trades
Salty ideas cooking
For Beachman’s other portfolio, check out Beachman’s Investing Brief that delivered an average annual return of +141% at a CAGR of +43% over the past 6 years.
P.S. Stock Analysis (SA), my favorite financial research service, is offering a special discount exclusively for us. SA provides comprehensive, timely market data via a well-designed, easy-to-use experience and at a very attractive price point. Use the link StockAnalysis and the promo code “BEACHMAN” for an extra 10% lifetime discount.
Beachman’s market BUY/SELL/HOLD signal
The Nasdaq double topped at the $636 mark and has been living comfortably under the all important 50DMA for two weeks.
See the chart below…
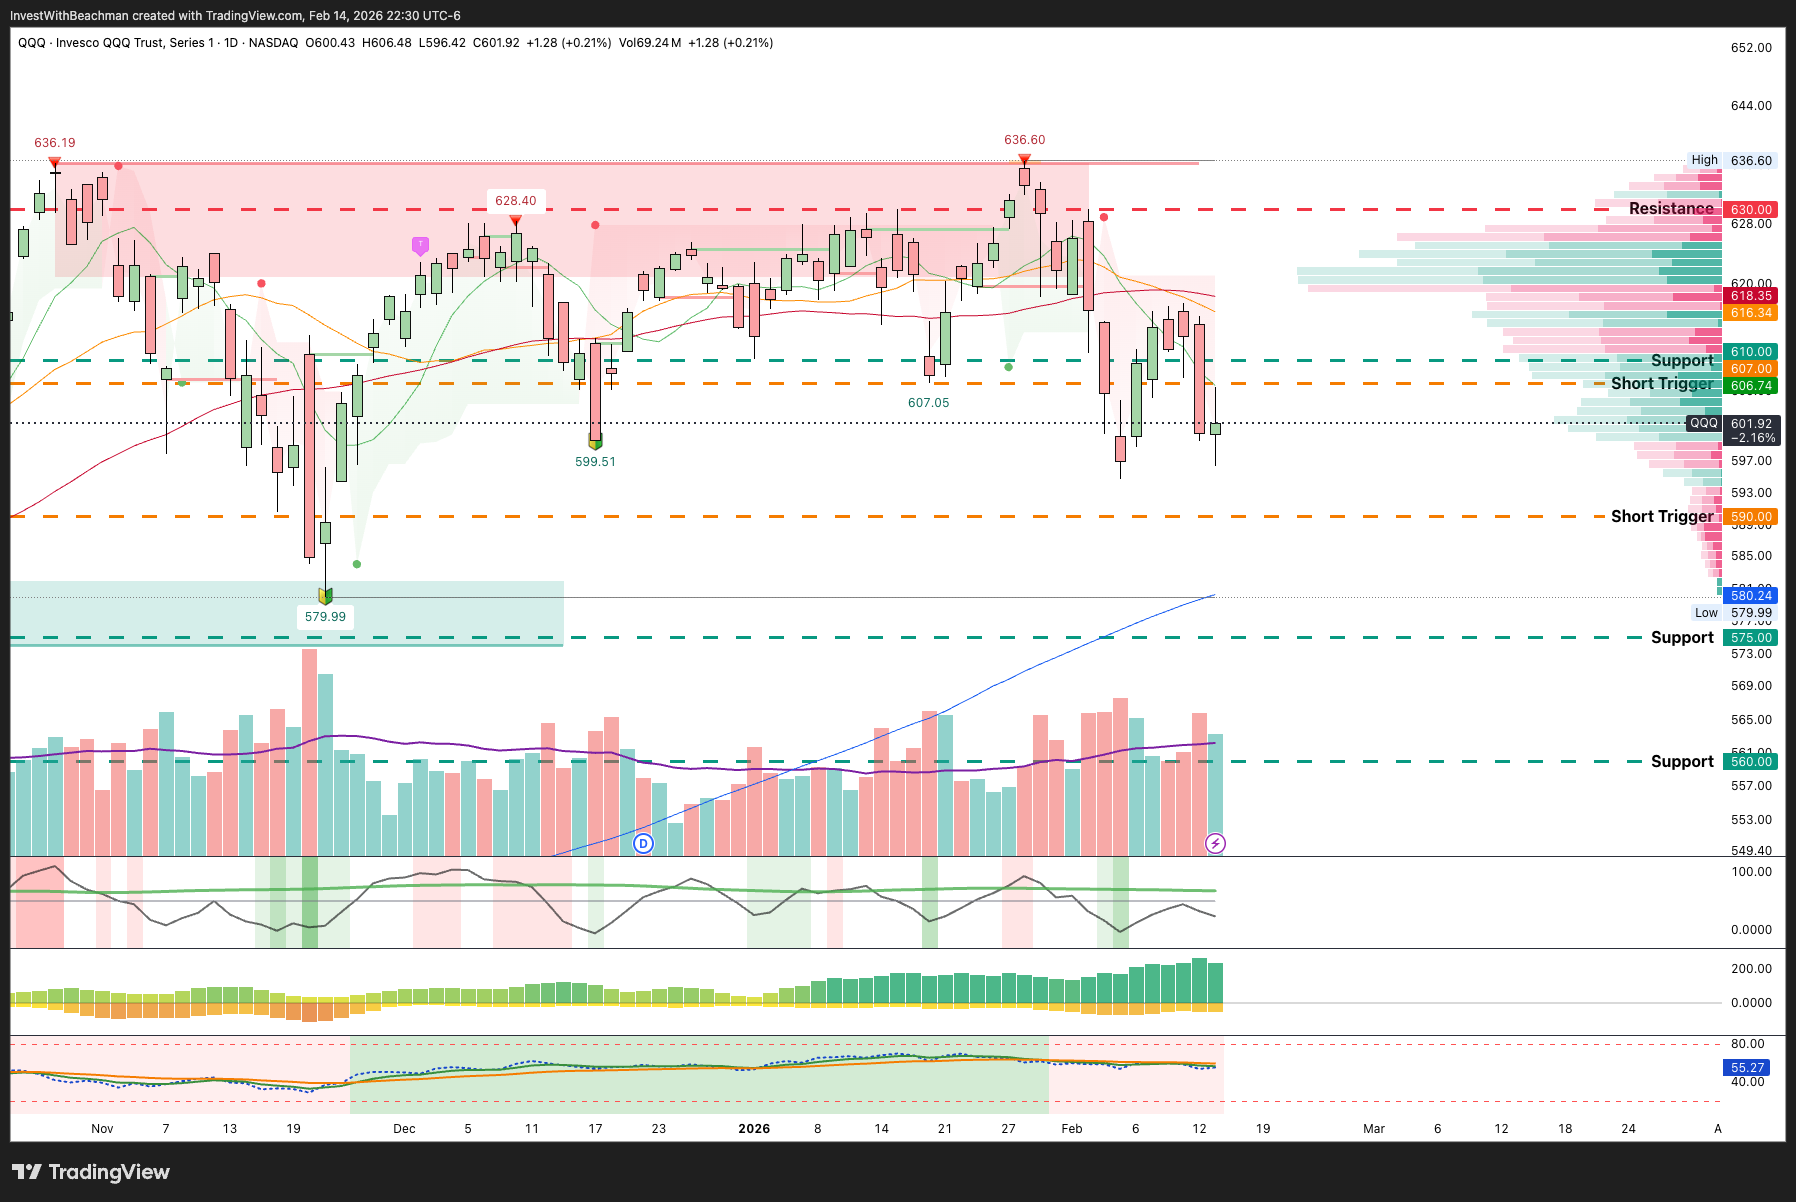
9 of the past 13 days have seen mostly selling-heavy volume. This has pushed more stocks below their own 50DMAs.
When we look at the SP500, the situation is no different. The volatility of the average stock in the SP500 index spiked to about 11% over the last month, the highest since the Great Financial crisis. At the same time, the index has been range-bound in a +/-3% pocket. Such divergence has been observed only 1% of the time over the last 30 years…during periods of extreme market stress.
The market is falling apart under the hood.
Our market signal remains in a 🔴 SELL mode.
However, we believe that we now have a clearer understanding of if and when there will be a bounce higher.
Here is how and why…